🚨: We’ve updated our Exposures functionality to provide deeper financial insights and a more intuitive data entry experience. These enhancements include expanded category options, a reorganized layout that prioritizes your active data, and a simplified way to compare your estimated values against your actual results
Exposures Enhancements
We’ve streamlined how you manage and view your data to make reporting faster and more intuitive.
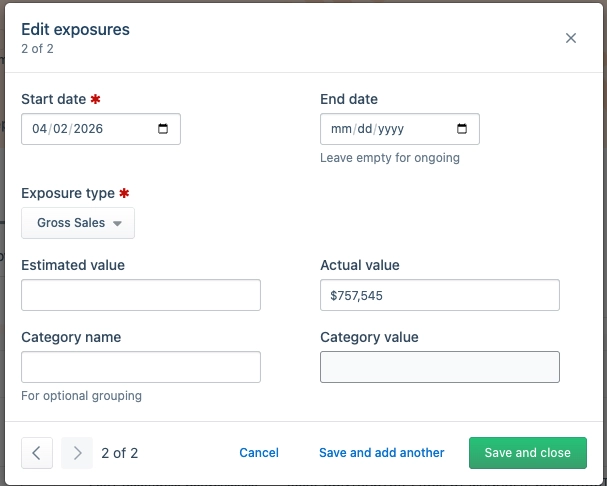
- More Categories: We’ve added 7 new exposure types, including Gross Sales, Net Sales, COGS, and Hourly Fringe, giving you a more detailed view of your finances.
- Note: With the addition of Gross Sales, we recommend your team chooses either "Gross Sales" or "Gross Revenue" and uses that selection consistently for all future reporting.
- Easier Comparisons: "Estimated" and "Actual" values are now in separate columns. You can now compare your projections against your results side-by-side in a single row.
- Smarter Layout: Your data now moves to the top. When viewing a location, any entered exposures will appear first, so you no longer have to scroll past empty sections to find your information.
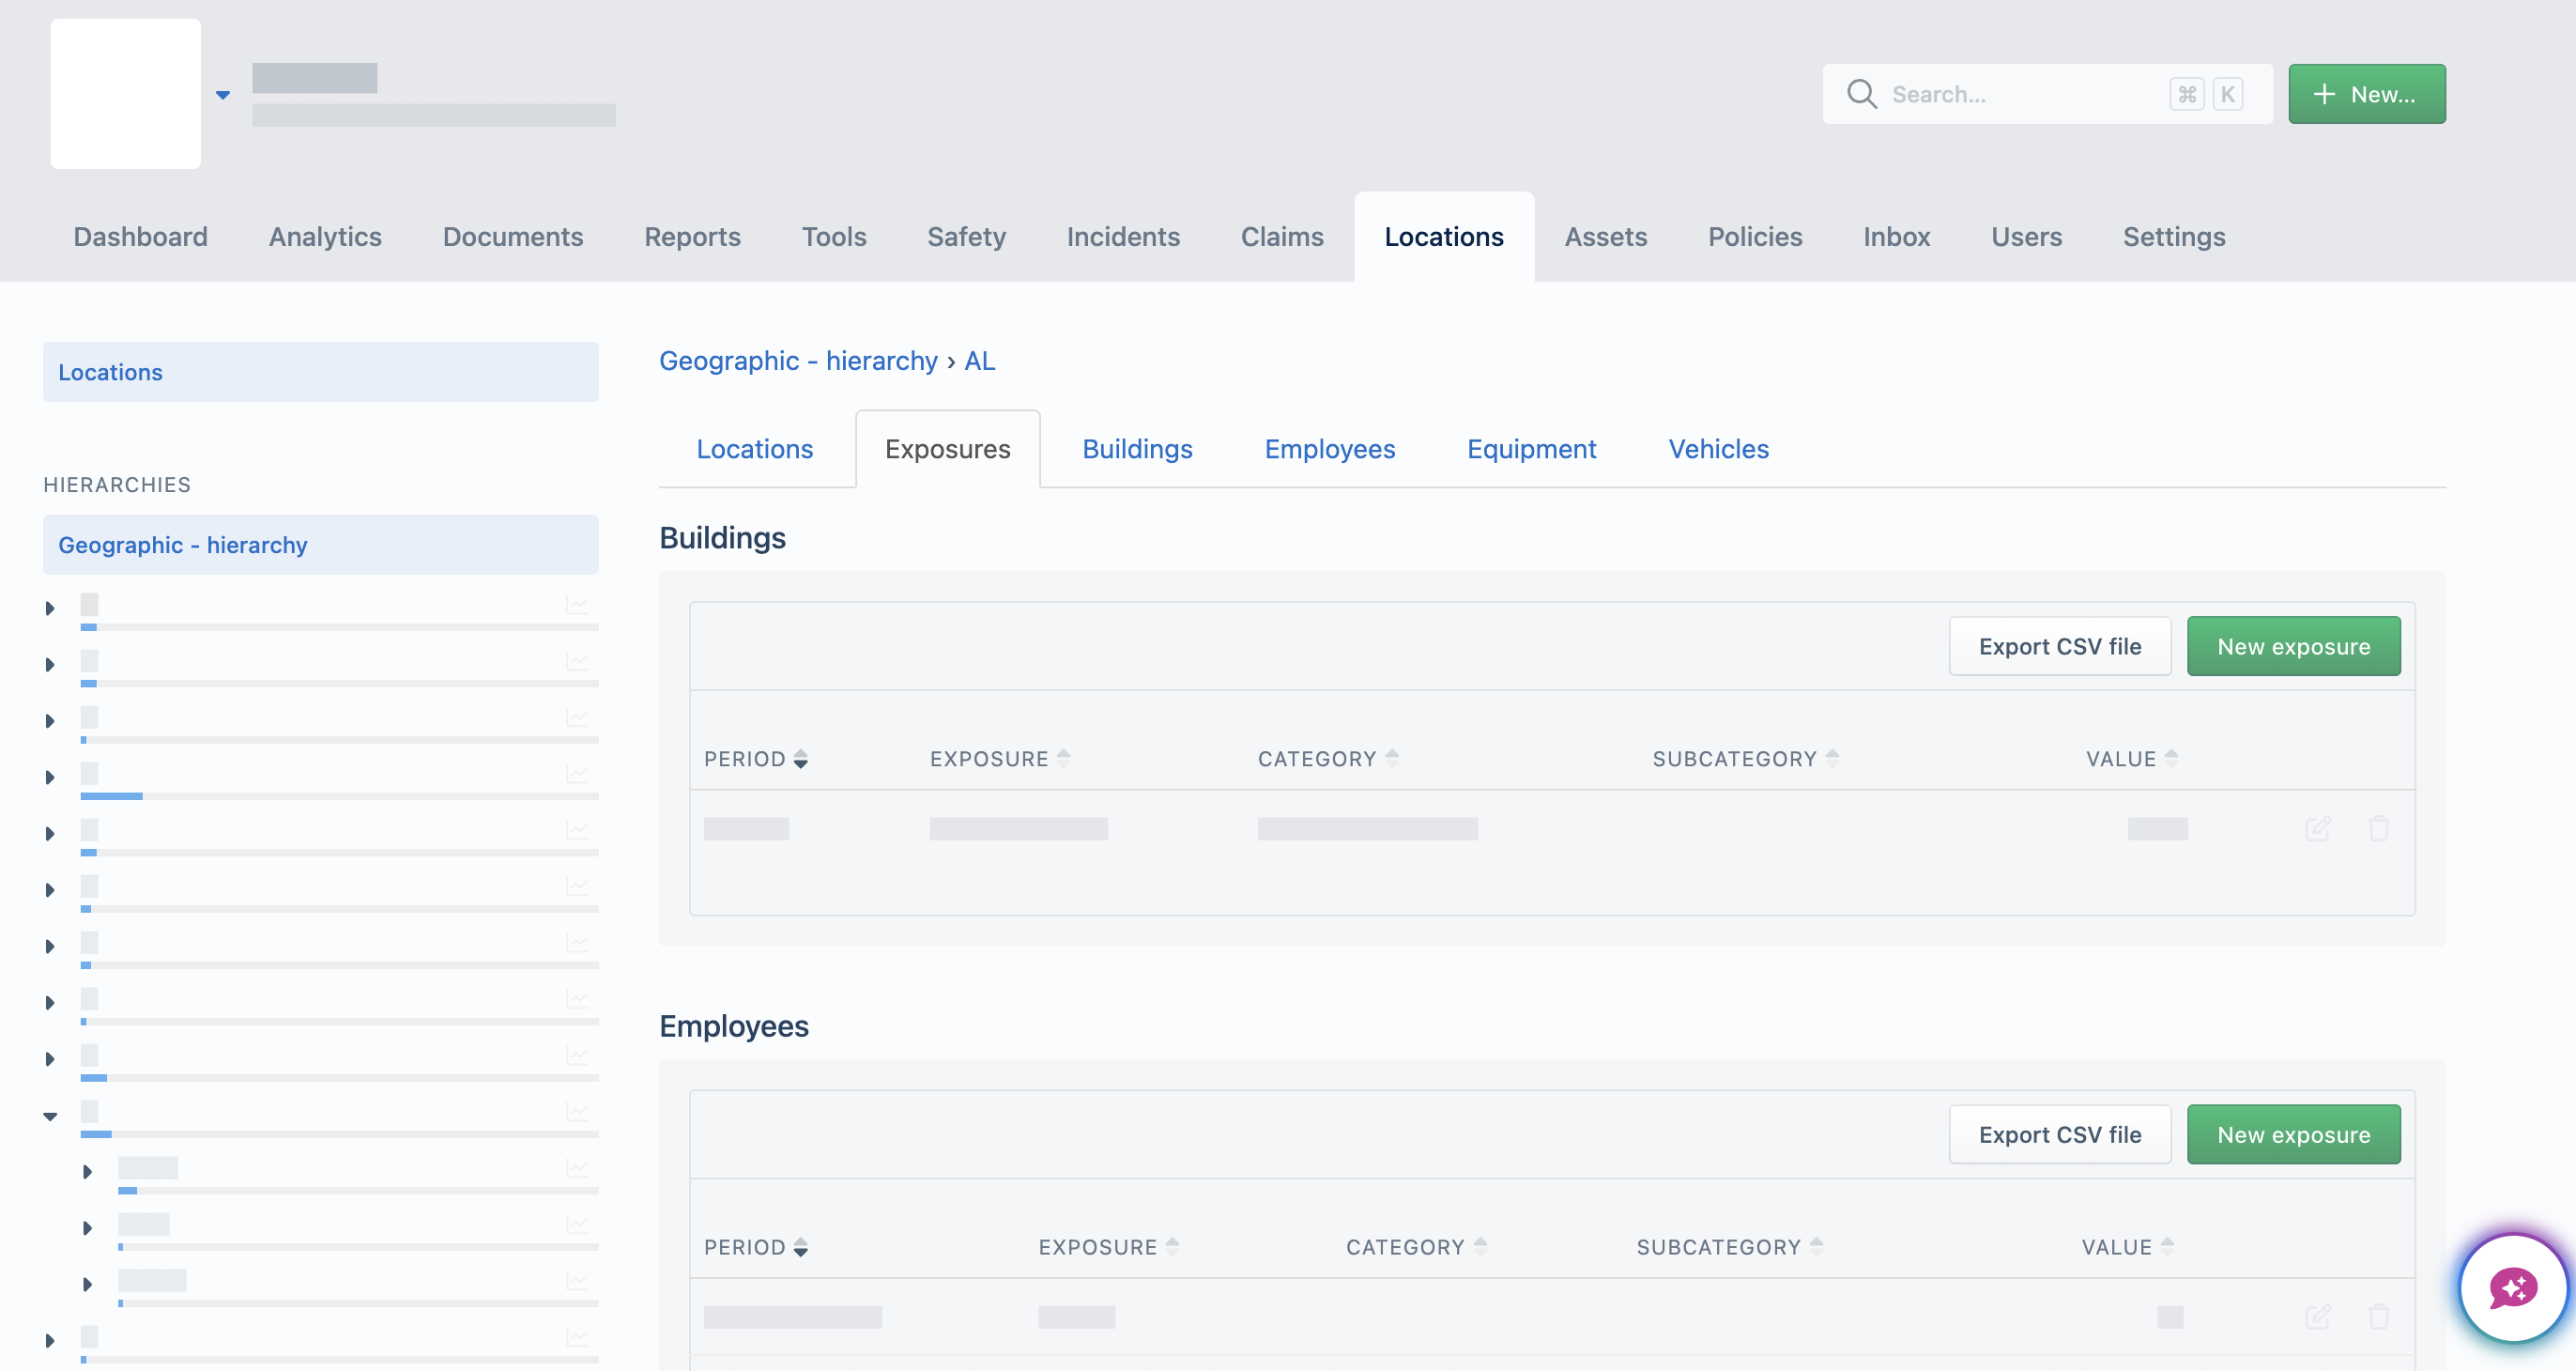
The example above illustrates the updated Exposures layout now available in Aclaimant.
Policy Programs
We are excited to announce the General Availability of the Policy Programs module. Designed for Risk Managers handling complex Property & Casualty portfolios, this tool replaces static spreadsheets with interactive, graphical Policy Tower Diagrams.
The Power of the "Mud Map"
Commercial insurance programs are complex stacks of primary and excess layers. Our new module provides a consolidated visual "safety net," allowing you to:
The Power of the "Mud Map"
Commercial insurance programs are complex stacks of primary and excess layers. Our new module provides a consolidated visual "safety net," allowing you to:
- Visualize the Stack: See exactly how policies and carriers stack by attachment point and limit.
- Identify Gaps: Spot unplaced capacity or "ventilated" coverage before they become liabilities.
- Drill into Details: View carrier participation, percentage shares, deductibles, and premiums directly within the tower.
How It Works
- Create: Set up a program under the Policies tab.
- Build: Add policies from the Policy Complex module to the program table.
- Analyze: Generate the Policy Tower Diagram to audit your program design and communicate strategy to stakeholders.
Key Highlights for Risk Managers
- Consolidated Metadata: Track coverage lines, aggregate limits, and policy years in one view.
- Layer Logic: Effortlessly manage complex positions (e.g., "$250M xs $1.3B") and "part of" participations.
- Stakeholder Ready: Export visualizations for clear, professional reporting in board meetings.
Comments
Please sign in to leave a comment.